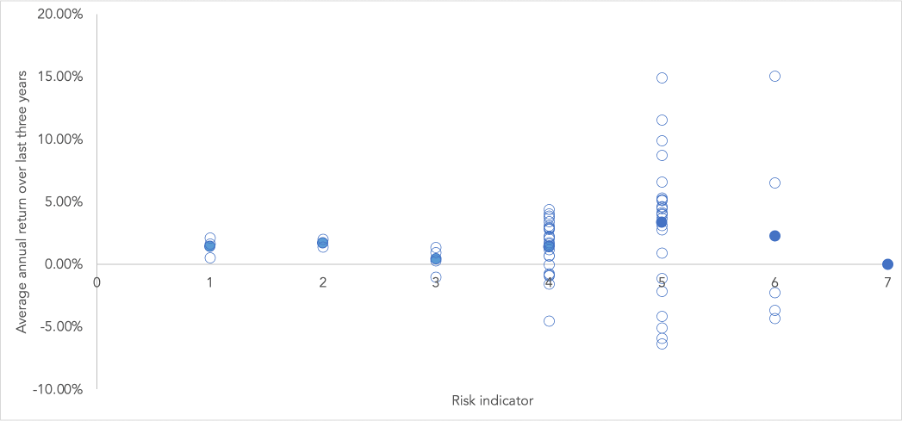
Returns on QROPS funds compared with their risk indicator
The FMA requires that New Zealand QROPS produce risk indicators for their funds. The risk indicator is rated from 1 (low) to 7 (high). The rating reflects how much the value of the fund’s assets goes up and down. A higher risk generally means higher potential returns over time, but more ups and downs along the way.

To help you clarify your own attitude to risk, you can seek financial advice or work out your risk profile at www.sorted.org.nz/tools/investor-kickstarter.
Note that even the lowest category does not mean a risk-free investment, and there are other risks that are not captured by this rating. This risk indicator is not a guarantee of a fund’s future performance. The risk indicators can be based on a combination of market index returns data and actual returns for a 5-year period depending on how long the funds have been traded. While risk indicators are usually relatively stable, they do shift from time to time.
We have analysed over 67 funds across 10 different QROPS schemes that are also portfolio investment entities in New Zealand. We looked at the average annual growth rates (after taxes and fees) of the funds within the schemes over the last three years. We selected the last three years as the FMA has recently indicated that looking at only the last 12 months returns can be skewed by the market effects during and subsequent to COVID-19. The purpose of this analysis is to show whether there is variability in returns across funds within the same risk indicator category, it is not to make any recommendation on individual funds.
The results, plotted in Figure 1, show that nearly all funds returned positive compound annual growth over the three years. The solid blue dots represent the average return across all funds for each risk indicator, the circles represent the individual investment fund options within the schemes. If you want to know how a schemes funds stack up contact us today.
The average annual fund growth (across the funds that we looked at) for the risk indicator 3 was 0.42%, for category 4 it was 1.40% and for category 5 is was 3.35%.
Figure 1: Returns of funds mapped against the funds risk indicator

Source: Based on New Zealand superannuation schemes fund updates as at 31 March 2024, 2023 and 2022.
If you already have a New Zealand scheme and want to compare their returns with other schemes in the market or against the average contact us and we will send you through the detailed information.
Further analysis shows that within the different risk indicators there is a significant variance of returns across the funds. The variability in the results show the importance of understanding each schemes funds and how they compare with the market. The table below summarises the differences across the risk indicator types and shows that as the risk indicator increases so too does the spread of returns (as shown in the increase in the standard deviation from the mean returns).
Table 1: Variability of average annual fund growth over last three years
| Average annual returns over last three years | ||||
| Risk indicator | Mean | Maximum | Minimum | Standard deviation from mean |
| 1 | 1.41% | 2.11% | 0.50% | 0.83% |
| 2 | 1.70% | 2.00% | 1.39% | 0.43% |
| 3 | 0.42% | 1.35% | -1.03% | 1.04% |
| 4 | 1.40% | 4.39% | -4.55% | 1.99% |
| 5 | 3.35% | 14.93% | -6.38% | 5.27% |
| 6 | 2.26% | 15.05% | -4.35% | 8.39% |
| 7 | 0.00% | 0.00% | 0.00% | |
Source: Based on New Zealand superannuation schemes fund updates as at 31 March 2024, 2023 and 2022
Methodology
To calculate the compound average annual growth rate of each fund over the last three years we:
- Reviewed QROPS that are portfolio investment entity schemes – as there is a more limited number of funds within these schemes
- Looked at each fund that was on offer between 31 March 2022 and 31 March 2024
- Took the annual return of the funds in each of the three years ending 31 March 2022, 31 March 2023 and 31 March 2024 and multiplied them out to give a total return over those three years
- Where the fund started during the year ended 31 March 2022 but did not have full return data for that year we used the market index return for that fund
- Once we had the total return over three years we annualised that figure to give the amount that the fund had grown on a compound annual average return basis
Disclaimer
We do not warrant the performance of the funds nor any New Zealand Superannuation Scheme. Past performance is no predictor of future performance. The information provided has been calculated using publicly available information, we do not warrant the accuracy of the underlying data provided in the source information. Any decisions made based on this data are the sole responsibility of the person making the decision and Charter Square Services Limited takes no responsibility for those decisions. Transferring a pension is a complex decision with many factors effecting each individual personally and we recommend that you get financial advice before proceeding.

